
U.S. Data Center Power Consumption: The Real Numbers by State
Updated August 2026
Data centers now use more electricity than most people realize — and the growth curve is steep. Here's what the actual data shows, state by state, and what it means for your electricity rate.
At a Glance
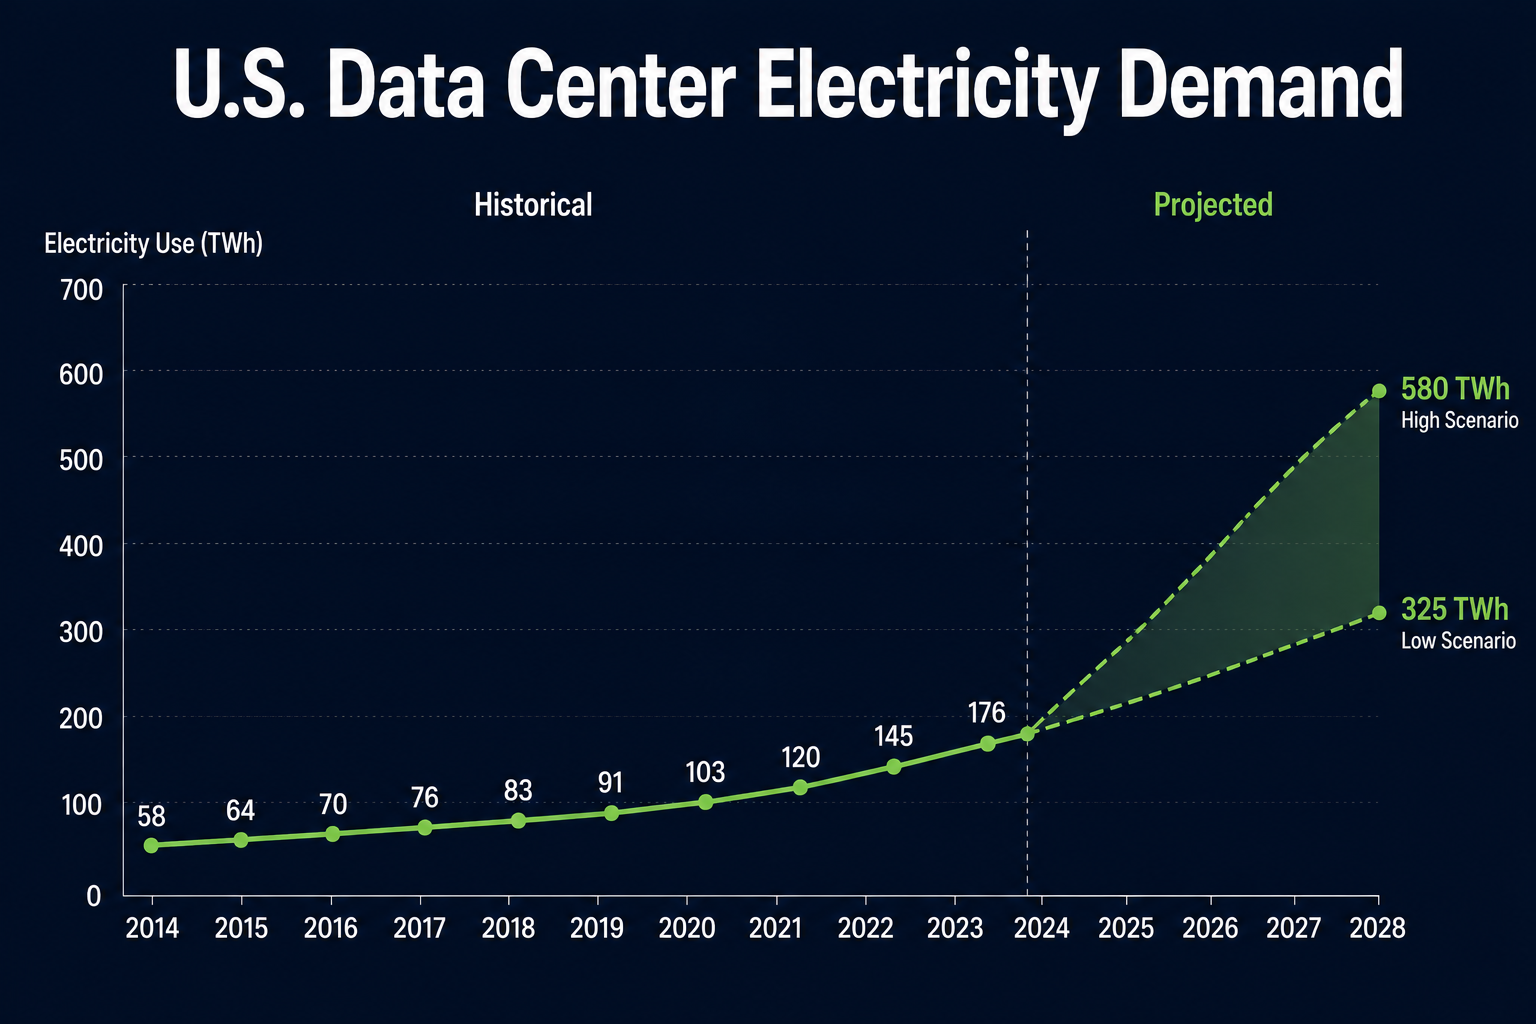
These figures come from the U.S. Department of Energy's 2024 Report on U.S. Data Center Energy Use, produced by Lawrence Berkeley National Laboratory. The report found that total data center electricity consumption climbed from 58 TWh in 2014 to 176 TWh in 2023 — and is projected to double or triple again by 2028, potentially reaching between 325 and 580 TWh, or as much as 12% of total U.S. electricity.
How Fast Is This Growing?
The growth isn't gradual. Data center demand held roughly steady through the mid-2010s, then began climbing sharply as cloud computing, streaming, and more recently AI model training and inference drove a surge in new facility construction. Hundreds of new data centers are under construction across dozens of states right now, representing enormous new electricity demand hitting the grid over the next several years.
Which States Have the Most Data Center Power Demand?
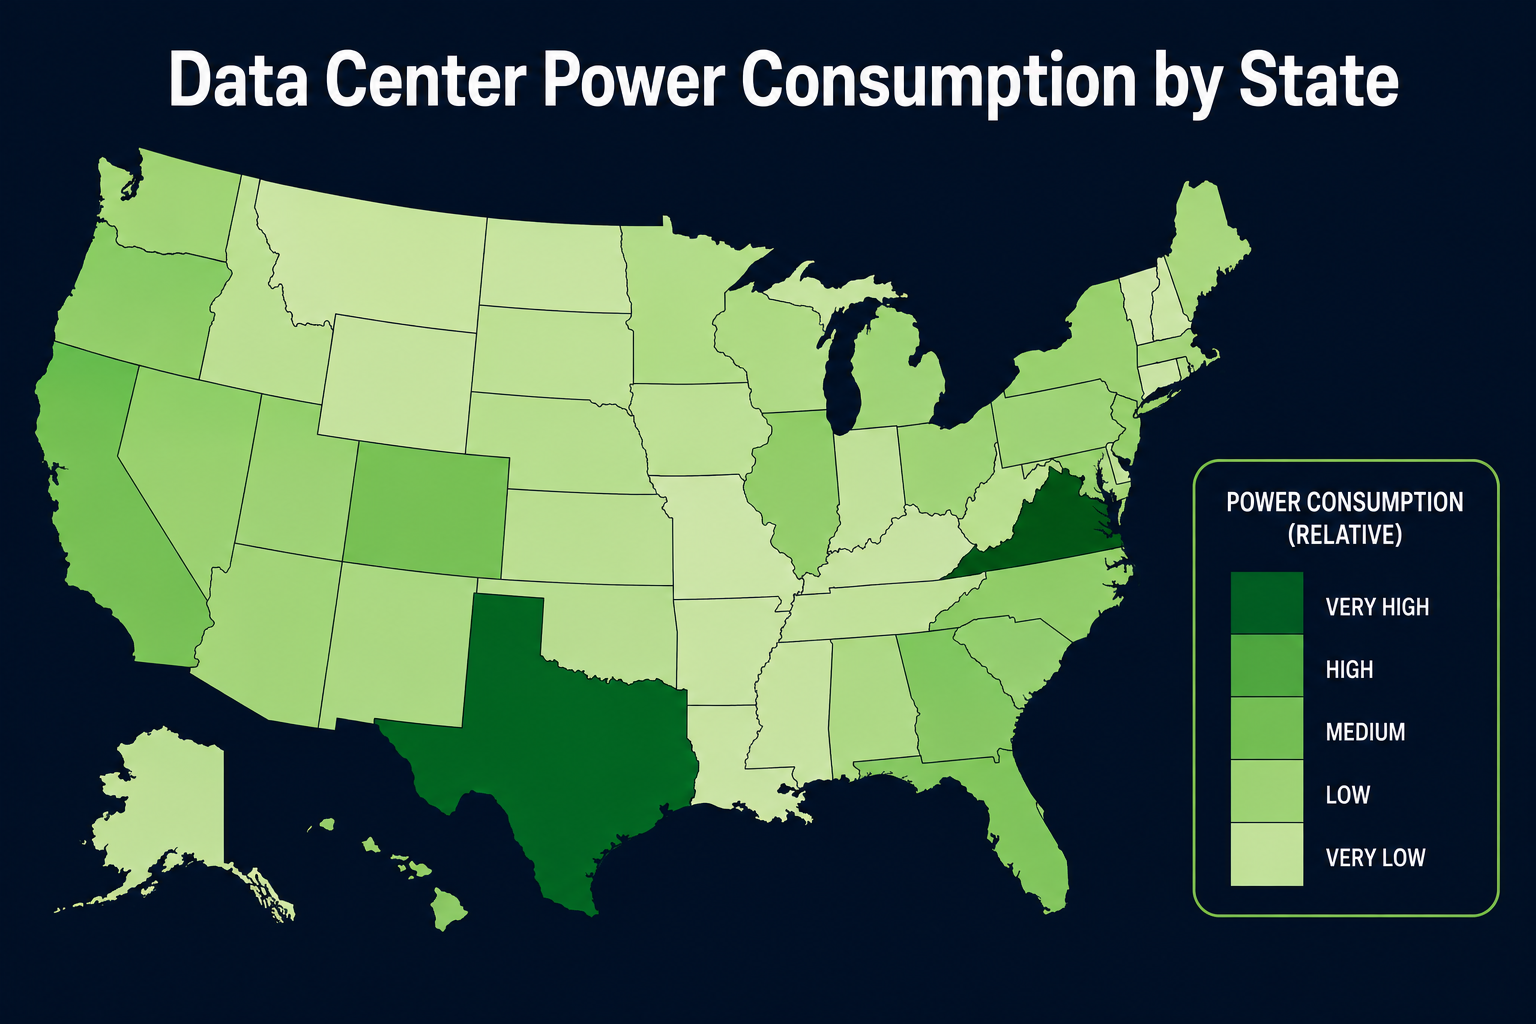
Virginia leads the country by a wide margin, driven by the dense concentration of facilities in Northern Virginia's "Data Center Alley" — one of the largest data center hubs in the world. Texas follows, driven partly by the state's relatively fast permitting environment and available power capacity in parts of the ERCOT grid. Other states with significant data center electricity demand include Ohio, Georgia, and Arizona, each benefiting from a combination of available land, grid capacity, and tax incentives that have attracted large-scale facility construction. Many of these are also deregulated energy markets.
| Why | ||
|---|---|---|
| Virginia | Very High | Northern Virginia's "Data Center Alley" — the largest hub in the world |
| Texas | Very High | Fast permitting and available ERCOT capacity |
| Oregon | High | Low-cost hydro power attracts hyperscalers |
| Ohio | High | Central Ohio build-out around Columbus |
| Illinois | High | Chicago-area interconnection hub |
| Georgia | High | Rapid metro Atlanta expansion |
| Colorado | High | Denver metro growth corridor |
| California | High | Silicon Valley legacy plus inland campuses |
| Arizona | High | Large Phoenix-area campuses |
| Wisconsin | Medium | New large-scale projects underway |
| Washington | Medium | Central Washington hydro corridor |
| Utah | Medium | Utah County cluster |
| South Carolina | Medium | Upstate industrial corridor |
| Pennsylvania | Medium | PJM grid access near Philadelphia |
| North Carolina | Medium | Research Triangle and western sites |
| New York | Medium | Downstate colocation plus upstate campuses |
| New Mexico | Medium | Emerging southwestern sites |
| New Jersey | Medium | Northeast corridor edge facilities |
| Nevada | Medium | Reno–Tahoe industrial campuses |
| Michigan | Medium | Southeast Michigan expansion |
| Florida | Medium | Miami and Tampa interconnection points |
| Tennessee | Low | TVA territory projects |
| Oklahoma | Low | Pryor and Tulsa-area sites |
| Nebraska | Low | Omaha-area hyperscale campuses |
| Missouri | Low | Kansas City metro sites |
| Minnesota | Low | Twin Cities colocation |
| Iowa | Low | Wind-powered hyperscale campuses |
| Indiana | Low | Power-rich, attracting new large loads |
| Alabama | Low | Limited but growing footprint |
| Wyoming | Very Low | Cheyenne cluster, small statewide share |
| West Virginia | Very Low | Minimal current demand |
| South Dakota | Very Low | Minimal current demand |
| North Dakota | Very Low | Small but growing |
| Montana | Very Low | Minimal current demand |
| Mississippi | Very Low | Early-stage development |
| Louisiana | Very Low | New projects announced, low current load |
| Kentucky | Very Low | Limited facility concentration |
| Kansas | Very Low | Small existing footprint |
| Idaho | Very Low | Boise-area sites only |
| Arkansas | Very Low | Minimal current demand |
Relative demand levels reflect each state's data center electricity demand compared with other states, based on DOE/LBNL national reporting and publicly announced facility concentration. Per-state TWh figures are not published consistently across all states.
The Growth Trend, 2014 to 2028
Do Data Centers Raise Electricity Rates?
The honest answer is: it depends on where you live, and it's genuinely contested.
In Virginia, data centers now account for a substantial share of the state's total electricity consumption — by some estimates, more than one in four kilowatt-hours used statewide. When that much new demand hits a grid at once, utilities often need to build new transmission and generation infrastructure to keep up, and those costs can get spread across all ratepayers, not just the data centers themselves.
Virginia's dominant utility has stated that data centers do not currently have an outside influence on customer energy bills, and a 2024 study by Virginia's Joint Legislative Audit and Review Commission agreed that data centers are currently paying their fair share of costs — while cautioning that residential customers could eventually bear some cost if policies don't adapt as demand grows. In response, some utilities have created dedicated rate classes specifically for large data center customers, designed to keep those costs separated from residential billing.
In power-rich regions with abundant grid capacity, like parts of West Texas and Indiana, large new industrial customers sharing the fixed costs of the grid can actually help lower rates for existing residential customers, since those fixed infrastructure costs get spread across a larger base of usage. Some large data center projects have committed to covering their own infrastructure build-out costs entirely, without passing expenses on to existing utility customers. You can benchmark your own spend against average electric bills by state.
Data Center Water Use: Separating Fact From Exaggeration
Data center water consumption has become one of the most misunderstood topics in this conversation. Here's what the evidence actually shows.
Claim: Every AI chatbot query uses a full bottle of water.
✗ FalseThis is a distortion of real research. A widely cited University of California, Riverside study actually found that roughly 20 to 50 chatbot queries together use about 500 milliliters of water — working out to somewhere around 10 to 25 milliliters per individual query, a few teaspoons, not a full bottle.
Claim: Data center water figures are wildly inflated.
✓ TrueThis one has real merit. Many widely circulated water statistics combine water used directly on-site for cooling with water consumed indirectly upstream by the power plants generating a data center's electricity. Independent research estimates roughly 80% of a data center's total water footprint actually comes from the electricity grid, not the facility itself — a distinction rarely made clear in headline statistics. Direct, on-site U.S. data center water use is estimated at approximately 17 billion gallons per year, representing a small fraction of total public water supply nationally.
Claim: Data centers are draining local water supplies.
↔ It DependsThis is genuinely situational, not a simple yes or no. Nationally, data center water use is a small fraction of total usage — but national averages can mask real local strain in specific communities, particularly in already water-stressed regions where multiple large facilities cluster together. The concern isn't really about the national picture; it's about specific locations where water resources are already tight.
Claim: Major tech companies aren't addressing their water use.
⚠ MisleadingThis doesn't hold up against the evidence. Several major cloud providers have made significant, measurable water replenishment and efficiency commitments in recent years, including large-scale water replenishment projects and next-generation data center designs using closed-loop cooling systems that use dramatically less water than traditional approaches.
What This Means for Your Electricity Bill
If you're in a state with significant new data center construction, it's worth keeping an eye on how your utility is structuring rates for these large new customers — some states are actively creating separate rate classes specifically to prevent cost-shifting onto residential customers. Regardless of what's driving change in your area, the fundamentals stay the same: checking whether your current electricity rate is still competitive is always worth doing, especially as grid dynamics shift. Let Maya AI from 97 Options do the comparison for you.
Check your rate now →Frequently Asked Questions
How much electricity do U.S. data centers use?
As of 2023, U.S. data centers used approximately 176 TWh annually, or about 4.4% of total U.S. electricity consumption, according to the Department of Energy's 2024 report produced by Lawrence Berkeley National Laboratory.
Which state has the most data center electricity demand?
Virginia currently leads, driven by its dense concentration of facilities in Northern Virginia, followed by Texas and several other states with available grid capacity and favorable permitting environments.
Will data centers make my electricity bill go up?
It depends heavily on where you live. In some regions, large data center demand has prompted infrastructure investments whose costs can affect all ratepayers. In other regions with more available grid capacity, large new industrial customers can actually help lower costs for existing customers by sharing fixed infrastructure expenses.
Is it true that AI queries use a lot of water?
The commonly repeated claim that a single AI query uses a full bottle of water is a distortion of the actual research, which found usage closer to a few teaspoons per query on average. Real data center water use is a genuine topic worth understanding accurately, but many widely shared statistics significantly overstate it.
Is data center electricity demand still growing?
Yes, significantly. Demand has roughly tripled over the past decade and is projected to double or triple again by 2028, driven heavily by cloud computing growth and the recent surge in AI model training and deployment.